


Characterization of the synthesized NPs
UV visible absorption
The UV–vis absorption spectra of ZnO materials are depicted in Fig. 2(a). Both samples exhibited UV–vis absorption spectra, with a wide intense absorption from about 350 nm, which may be linked to the intrinsic absorption of the BG of ZnO NPs caused by electron (e−) transfer out from VB towards the CB34,43,44,45,46.

(a) UV–Visible absorption spectrum (b) Inset. Plot of (αhυ)2 versus photon energy of Green-ZnO and Chem-ZnO.
Since ZnO is a direct band gap Semicond., its ABS coefficient (α) is correlated to the excitation energy by the formula:
$$\mathrm\alpha h\upsilon =\mathrmA\left(\mathrmh\upsilon -E_g\right)^\mathrmn$$
where A is a proportionality constant, h is the Planck constant, v is the frequency of vibration, and n is an exponent, 1/2, that characterizes direct allowed optical transitions.
Eg is calculated by plotting (αhυ)1/n vs. (hυ) and extrapolating to (αhυ)1/n = 0 (Fig. 2b). The extrapolation of the linear part until its intersection with the photon axis was employed to approximate the optical BG. From Fig. 2(b), Eg values are 3.16, and 3.07 eV for Green-ZnO, and ZnO-Chem respectively47,48,49. It denotes a widening of the optical BG for the Green-ZnO compared to Chem-ZnO. It is thought that a significant contributing element to this blueshift is the quantum size effect. As the grain size decreases, the continuous energy bands split off into discrete levels, causing the effective expand of the BG. Similar earlier reports also noted these results44,50,51.
X-ray diffraction (XRD) analysis
The XRD patterns of green produced ZnO NPs derived from zinc nitrate hexahydrate and Moringa leaf extract, as well as conventionally generated ZnO NPs formed from zinc nitrate hexahydrate and ammonium hydroxide are illustrated in Fig. 3.

XRD patterns of green and chemically synthesized ZnO NPs.
In both cases, the XRD graph demonstrated that the synthesized product was in crystal and that no further impurities could be found once compared to the structure known (ZnO, 04-016-6648). The reference pattern’s hexagonal structure and each of the prominent peaks in the samples were perfectly correlated.
The ZnO NPs’ acquired XRD pattern reveals the positions of 2 degree diffraction peaks at 31.75, 34.43, 36.23, 47.55, 56.58, 62.89, 66.42, 68.17, and 69.11 with matching Miller indexes (hkl) of (100), (002), (101), (102), (110), (103), (200), (112), (201) respectively. This demonstrates ZnO’s hexagonal wurtzite phase (JCPDS: 36-1451).
Scherrer’s formula was applied to the high intensity peak (101) to estimate the crystallite size : D = Kλ/β cos θ Where K is a constant (0.9), λ is the X-ray wavelength, and β is full width at half maximum (FWHM)52. ZnO NPs have an average crystallite size of 12.51 nm for Green-ZnO and 11 nm for Chem-ZnO. Based on the Debye–Scherrer equation, Both NPs showed almost the same crystallite size. Indeed, in XRD analysis, it should be noted that the crystallite size is assumed to be the size of a coherently diffracting domain and is not necessarily to be the same as the particle size. Furthermore, according to literature, it has been found that the XRD peak can be widened by defects and internal stress53,54.
FE-SEM analysis
The surface morphology of chemically produced and green ZnO NPs is examined using a FE-SEM.
The SEM image Fig. 4(a) of chemically formed ZnO reveals a range of irregularly shaped NPs clustered. We can observe that the chemically obtained ZnO have no defined geometry. On the other hand, the image of biosynthesized ZnO (Fig. 4b) reveals NPs with well-defined structures at the nanoscale relatively spherical in shape with clear separation49. These NPs are surrounded with biomolecules found in the extract, which maintain them apart and avoid agglomeration. This demonstrates that the addition of the plant extract throughout the reaction had a significant influence on the formation mechanism, ending a more defined pattern with less agglomeration35,55.

FE-SEM: (a) chemically synthesized and (b) biosynthesized ZnO NPs.
Furthermore, the green method’s obtained shape consolidates the physical properties of the NPs, enhancing their qualities and efficiency in many applications. Figure S1 allows us to determine an average size for the biosynthesized ZnO NPs of 13.95 nm. With obvious signals from the atoms of zinc and oxygen and the very low intensity of the carbon atom, the EDX spectrum (Figs. S2 and S3) of produced ZnO NPs reveals their chemical content and validates their purity49. The spectrum of Fig. S3 revealed additional peaks corresponding to Magnesium (Mg), Sulfur (S), Chlorine (Cl), Potassium (K) and Calcium (Ca) in very small quantities. Generally, these compounds are contained in the leaf extract of Moringa oleifera55,56,57.
TEM analysis
TEM images were used to investigate the in-depth properties of chemically synthesized and biosynthesized ZnO NPs. The TEM micrograph of chemically synthesized ZnO in Fig. S4(a) depicts the clustering and irregularity of chemically synthesized ZnO structures. On the other hand, Fig. S4(b) reveals TEM micrograph of the biosynthesized ZnO NPs, giving rise to isolated NPs relatively spherical in shape. This figure (Fig. S4b) is taken at high resolution and confirms the presence of spheroid-like and hexagonal shapes. The histogram in Fig. 5 shows the particle sizes of Green-ZnO NPs ranging from 9 to 18 nm in diameter, with an average size of about 14 nm and a standard deviation of 2.1. These outcomes validate the SEM analysis.

Particle size distribution histogram of Green-ZnO NPs.
The particles are distributed uniformly which is owing to the existence of organic compounds that encase the particles and act as a capping agent, blocking their aggregation. As a result, it is clear that biosynthesized ZnO has lower particle size and better morphological control than chemically produced ZnO35.
The SAED pattern (Fig. S4c–d) was displaying distinct bright dotty rings, demonstrating the particles’ crystalline structure, which is consistent with the XRD pattern shown in Fig. 3.The corresponding SAED pattern of the chemically synthesized ZnO displays more discrete spots, indicating the single crystalline nature compared to the biosynthesized, which could be because of the residual organic compounds used during the green fabrication process.
Surface area and porosity analyses
Nitrogen adsorption–desorption profiles using BJH and BET techniques were employed to assess the surface properties and the type of porosity of green and chemically produced ZnO NPs. The pore size distribution and porosities were obtained from the desorption isotherm branch by using BJH approach, and the specific surface area was acquired using the BET method.
The specific surface area of the biosynthesized and chemically produced ZnO NPs is 19.789 m2/g and 4.923 m2/g respectively. The creation of smaller particle sizes may be responsible for the increase in the surface area of green ZnO. Moreover, the pore volumes of Green ZnO and chemically synthesized ZnO are 0.149 cc/g and 0.020 cc/g, respectively. The quantity of ZnO active sites and surface area increase with increasing pore volume58,59, so increases the adsorption capacity, which therefore boosts the photocatalytic effectiveness. (Fig. S5a–d).
Heterogeneous photocatalysis for SRW treatment using ZnO NPs
Catalyst loading
Heterogeneous photocatalysis assays were conducted initially at free pH for 180 min with ZnO catalyst loads of 0.1, 0.25, and 0.5 g/L. All studies proceeded with a previous 30-min adsorption stage in the dark. This period of time was determined based on the results of the catalyst’s 60-min adsorption testing. Before the analytical processes, the samples collected were centrifuged for 10 min at 10,000 rpm.
Adsorption
It can be assumed that 0.1 and 0.25 g/L concentrations show an initial superior adsorption; however, 0.5 g/L concentration exhibits lower adsorption. Considering that the adsorption capacity typically rises with surface area, additional pollutant molecules are adsorbed on the surface given by a high catalyst loading60. However, a common tendency of a decline in the removal was seen.
Photocatalysis
As can be observed, 0.25 and 0.5 g/L achieve nearly identical final results at the end of the 180-min experiment. Analyzing the degradation response reveals that raising the concentration has no discernible effect on photocatalytic performance, which makes 0.25 g/L an optimum catalyst concentration.
Effect of initial pH
The surface charge of the semiconductor photocatalyst, the mechanism, and the rate of reactive oxygen species (ROS) formation are all significantly influenced by the solution’s pH value61. This, in turn, affects the rate of photocatalytic degradation of contaminants62,63.
The point of Zero charge pH (pHpzc) of ZnO is 8 according to Fig. 6 and in agreement with previous references64,65.
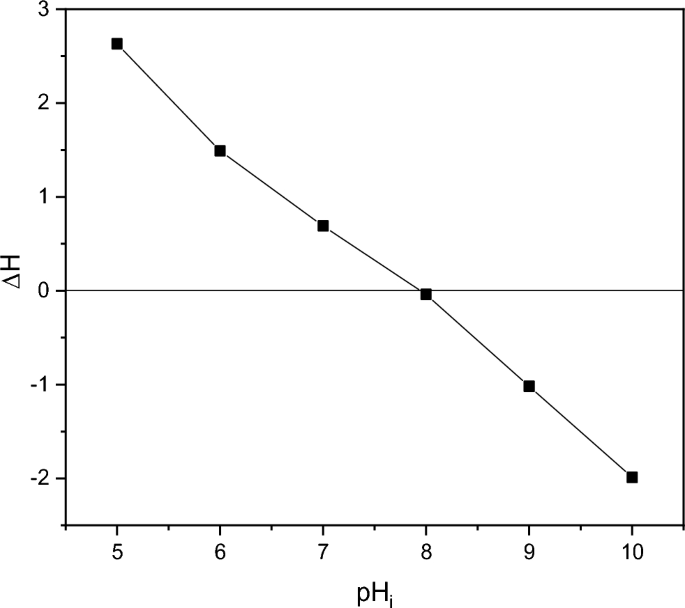
Point of zero charge (pHpzc) of biosynthesized ZnO nanoparticles.
In this regard, the elimination of each pollutant on ZnO at four distinct pH conditions viz. 5, 7, 8, and 9 have been studied at a constant concentration of catalyst 0.25 g/L. (Fig. 6). The C/Ci vs. time graph (where C denotes the concentration at various time intervals and Ci denotes the compound’s starting concentration) using the biosynthesized ZnO NPs (Green-ZnO) under simulated solar irradiation is shown in Fig. 7(a–d).

Effect of initial pH on the photocatalytic activity of biosynthesized ZnO photocatalyst toward (a) Phenol, (b) O-Cresol, (c) Toluene, (d) Xylene after 30 min dark and 180 min of irradiation.
The percentage of phenol destroyed is found to be very low in an acidic media. These observations can be related to the phenomenon having positively charged NPs surfaces, which causes protonation of active sites and hence alters phenol adsorption, thereby affecting its removal66. Adsorption on ZnO will be less in the basic pH range, where phenol is predicted to be in the ionized state. As a result, surface-mediated degradation will be reduced67. Therefore, the neutral pH was the best suited for the phenol degradation.
Giving the basic nature of o-cresol (pKa = 10.316), under acid media, it tends to be positively charged14,68. As it is shown, the photodegradation % rose marginally as the pH climbed from 5 to 7. Nevertheless, above the optimum pH 7, there was a decrement in photodegradation%.
The maximum degradation efficiency of Toluene and Xylene (88.30% and 93.13% respectively) was reached with pH 7 following 180 min in the simulated sunlight/ZnO system. Remarkably, the results were comparable at pH values 7 and 9.
The increased removal effectiveness at basic pH can indeed be attributed to the fact that, in alkaline pH, OH. are more readily formed via oxidation of more hydroxyl radicals, that are present on the ZnO surface, thereby boosting the process performance69,70.
In all the 4 compounds, at pH8, which is the pHpzc the results are the worse ones. This behavior could be related to a possible aggregation of catalyst particles. Indeed, the zero surface charge creates zero electrostatic surface potential for pH levels near to pHzpc, which cannot generate the interaction rejection required to isolate the particles inside the solution. Aggregation occurs as a result, and photocatalyst clusters get bigger71.
Green vs chemically synthesized ZnO photocatalyst
Figure 8(a–d) illustrates a comparison of time-dependent photocatalytic activity of both the Green-ZnO and the Chem-ZnO NPs towards each pollutant degradation. The photo-chemical analysis revealed that the degradation process with Green-ZnO within 180 min of irradiation resulted in 51%, 52%, 88%, and 93% of removal for Phenol, O-Cresol, Toluene, and Xylene respectively. However, in the case of Chem-ZnO, the percentage of degradation was 33%, 34%, 74%, and 89% of removal for Phenol, O-Cresol, Toluene, and Xylene respectively. The biosynthesis of ZnO clearly demonstrated a higher or quite equivalent degradation effectiveness in comparison to ZnO synthesized with conventional chemical route.

Photocatalytic activity of biosynthesized and chemically synthesized ZnO at optimum conditions toward (a) Phenol, (b) O-Cresol, (c) Toluene, (d) Xylene after 30 min dark and 180 min of irradiation.
A similar trend has been documented in prior studies that investigated dye degradation, whether using environmentally friendly or chemical synthesis methods72,73. It is widely assumed that the morphology, surface, and crystallinity of material are mainly responsible for its photocatalytic activity74. Indeed, the plant extract’s bioactive substances aid in the development of ZnO nuclei through capping but also stabilizing them. As a result, the green method produces NPs that have greater distribution, structure-tunable, and are size-controlled75,76,77 compared to the chemically synthesized sample, which could provide stability, a larger specific surface area, and reduced particle sizes, thus, high photogenerated charge carrier separation capabilities, enhanced light absorption and finally better degradation of pollutant molecules.
Tables S1, S2, and S3 in the Supplementary Information section offer a comparative analysis of our research findings with those from previous studies focusing on ZnO synthesized through various methods for the PC degradation of petroleum hydrocarbon contaminants. This comparison underscores the competitiveness of the results we have obtained in this study when compared to existing efficiency standards.
The primary objective of this research is to explore an environmentally sustainable, uncomplicated, and cost-effective solution that can either reduce the volume of waste discharged in effluents or promote the reuse of purified water, thus reducing the consumption of freshwater. The novel approach for photocatalyst synthesis employed in this study represents an initial step towards optimizing a more sustainable process, especially, when paired with sun energy, this allows an economically feasible route in the application of solar photocatalysis. Importantly, According to a previous study, the economical evaluation points out that the highest loads for the cost composition are due to catalyst synthesis, corresponding to 95% in a solar photocatalysis system34.
Ultimately, working with photocatalysts in form of powder needs a post-processing removal of the NPs from the liquid solution which could be an inefficient additional process step especially from an industrial perspective. For this reason, the development of photocatalysts immobilized as coatings is thus an improvement. That will require modifying the substrate, using a different thickener, or introducing a linker between ZnO and the substrate. In this case, the stability parameter and a study of reusability would be significant. We consider that an interesting topic for our ongoing and future research.


